广州海洋实验室唐丹玲团队在基于机器学习预测台风诱发海表面高度异常方面研究取得进展,相关成果近日以“Composite Analysis-Based Machine Learning for Prediction of Tropical Cyclone-Induced Sea Surface Height Anomaly”为题发表在SCI期刊IEEE JOURNAL OF SELECTED TOPICS IN APPLIED EARTH OBSERVATIONS AND REMOTE SENSING(影响因子:4.715)上。论文第一作者为广州海洋实验室-香港科技大学联培博士研究生崔红星,通讯作者为广州海洋实验室教授、广东省海洋生态环境遥感中心主任唐丹玲博士。合作单位包括深圳大学、Dalhousie University、香港科技大学和University of Kent。


热带气旋(TC)风泵作用引起的海面高度异常(SSHA)与振荡密切相关,是上层海洋中热层结构和海洋热含量的重要表征参数。然而,对热带气旋引起的海表高度异常的预测很少被研究。该研究提出了一种新的基于复合分析的随机森林(RF)方法来预测热带气旋诱发的海表高度异常,即利用热带气旋的特征和风暴前的上层海洋参数作为输入特征,预测热带气旋通过后30天内诱发的每日的海表高度异常。模拟结果表明,本方法能够准确地推断出不同强度组的热带气旋所引起的海表高度异常的振幅和时间演变。使用以热带气旋为中心的5°×5°的区域平均值,所提出的方法对热带气旋诱发的西北太平洋的海表高度异常进行了准确的预测,均方根误差为0.024m,优于其他机器学习方法和数值模式。此外,所提出的方法在不同的地理区域,如中国南海和北太平洋西部亚热带海域也表现出良好的预测性能。
该研究为利用机器学习在改善预测受极端天气条件下的海表高度异常方面的研究提供了新的见解,从海表面高度异常预测的新角度丰富了海洋风泵(wind-pump)生态环境效应理论。唐丹玲团队长期研究海洋风泵的生态环境效应;准确预测热带气旋风泵作用引起的海表高度异常可以更好地应对、减少极端事件(如风暴潮)对人类和经济财产的负面影响。
该研究由广东省特支计划U团队项目(2019BT02H594)、广州海洋实验室引进高端人才项目(GML2021GD0810)和国家自然科学基金面上项目(41876136)等资助;该成果是广州海洋实验室-香港科技大学联培博士研究生项目发表的的第一篇SCI论文。
论文全文:H. Cui, D. Tang, H. Liu, Y. Sui and X. Gu, "Composite Analysis-Based Machine Learning for Prediction of Tropical Cyclone-Induced Sea Surface Height Anomaly," in IEEE Journal of Selected Topics in Applied Earth Observations and Remote Sensing, vol. 16, pp. 2644-2653, 2023, doi: 10.1109/JSTARS.2023.3247881.

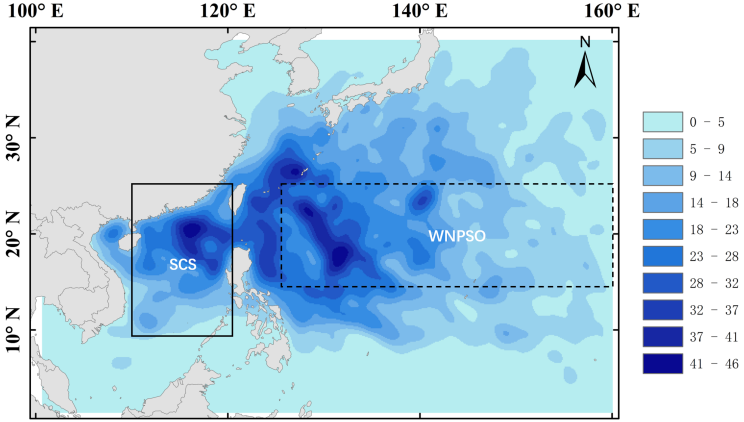
Fig. 1. The density of TC centers, with colors representing the number of TC centers at 6-h intervals from January 1998 to December 2018, and the spatial resolution is 0.1°×0.1°. The solid rectangle encloses the SCS; the dashed rectangle encloses the WNPSO.

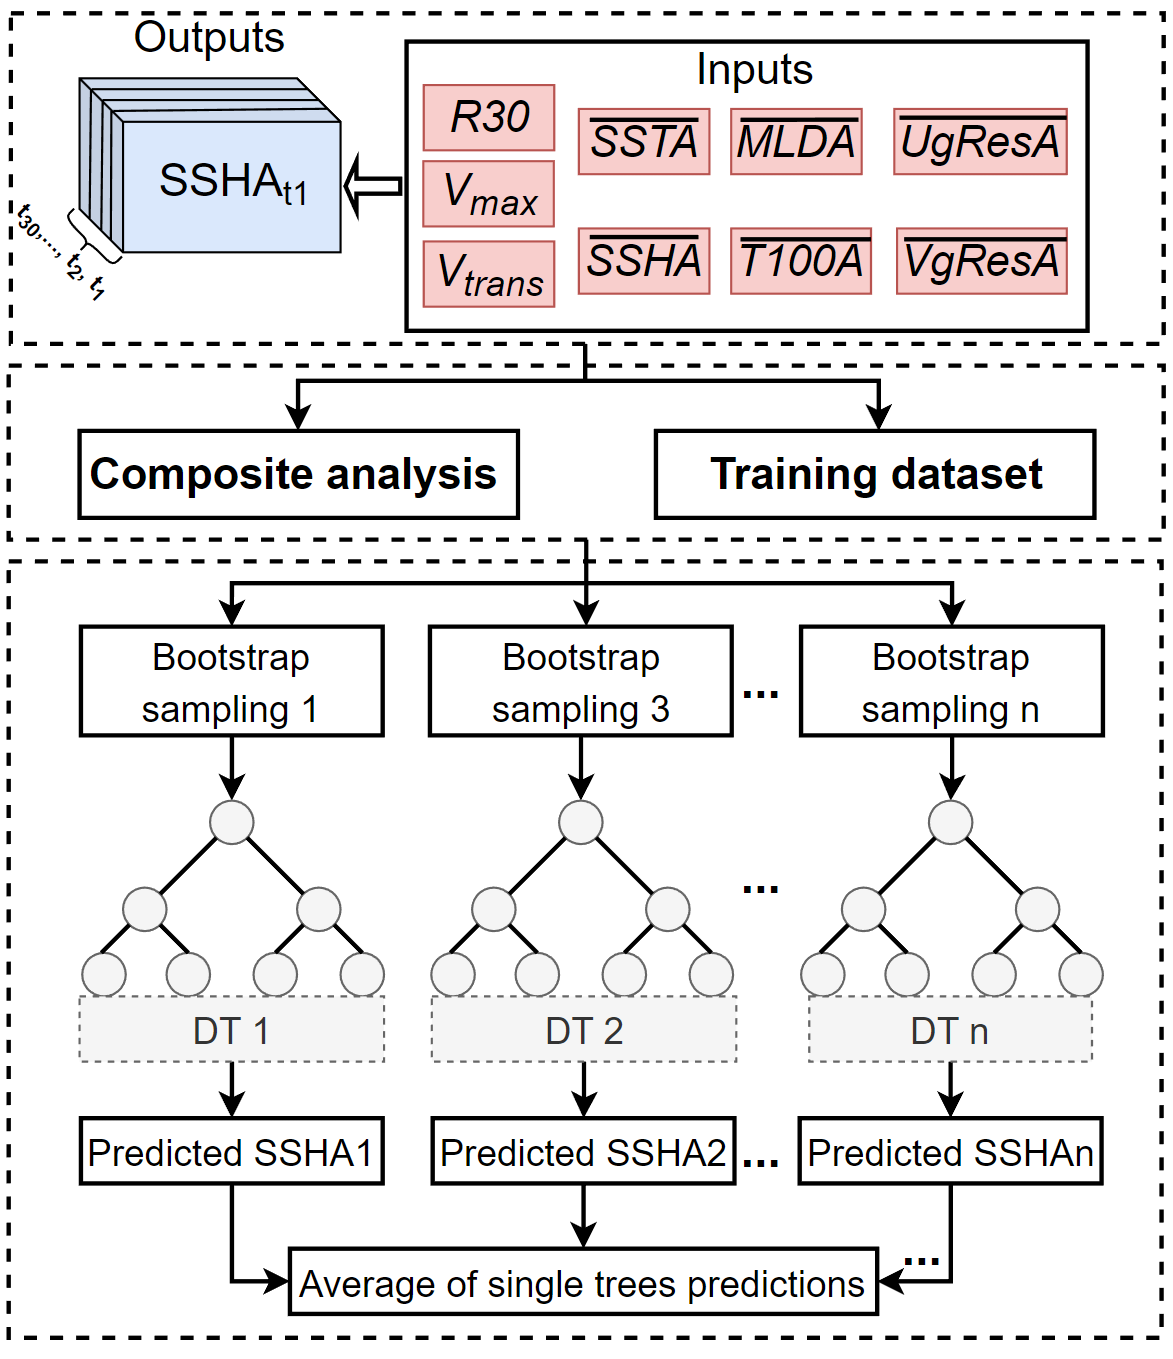
Fig. 2. Schematic diagram of data processing workflow. The subscript, i.e., t1, t2, …, t30, representing the 1st, 2nd, 3rd, …, 30th days after TC passage, respectively. SSHAt1, SSHAt2, SSHAt3, …, and SSHAt30 represent the TC-induced SSHA from the 1st, 2nd, 3rd, …, 30th days after TC passage, respectively

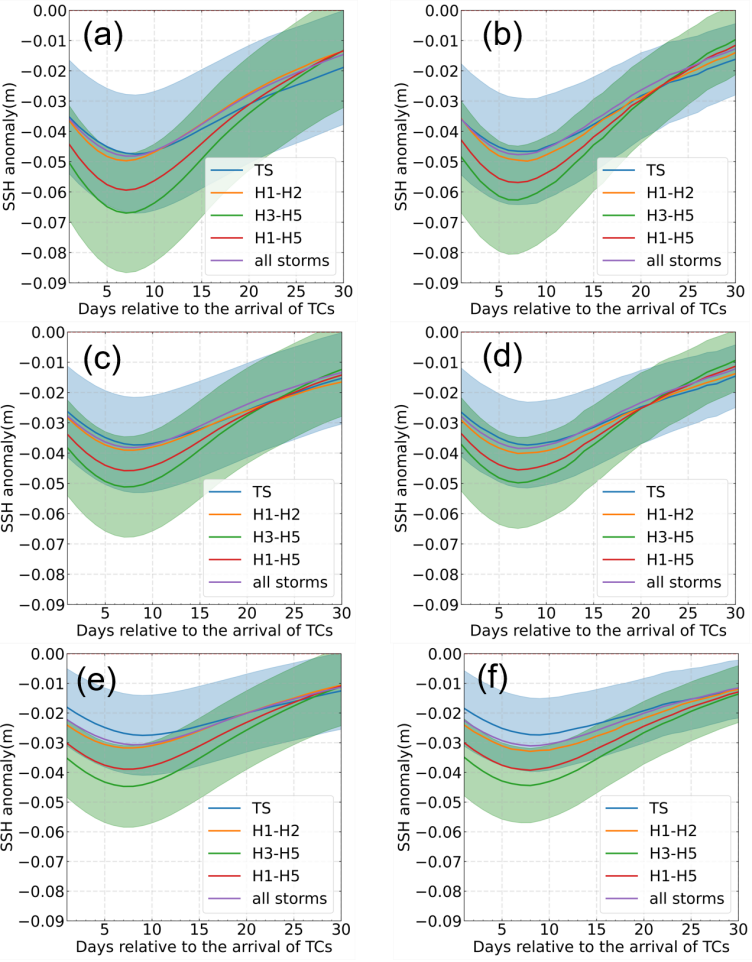
Fig. 5. (a) Temporal evolution of composite area-mean SSHA for a TC-centered 5°×5° box in association with passage of TCs based on the observations used in the testing stage. Error width are calculated as the standard deviation divided by the square root of the number of observations of the test set (i.e., standard error of the mean) and are shown by the width of the blue shading and green shading for TS and H3-H5 TCs, respectively. (b) As in (a), but from the predictions.

Fig. 8. (a), (c), (e) As in Fig. 5a, and (b), (d), (f) as in Fig. 5b, but for different TC-centered box sizes, i.e., 2°×2°, 3°×3°, 4°×4°, respectively.

 IOA登录
IOA登录 邮箱登录
邮箱登录 网站地图
网站地图 联系我们
联系我们 香港分部
香港分部 EN / 中文


